Measuring applications CPU cache performance using perf
Measuring memory reads with perf mem
Introduction to the different levels of memory
One of the performance gains that’s been relevant to me in my work recently is data locality and cache performance.
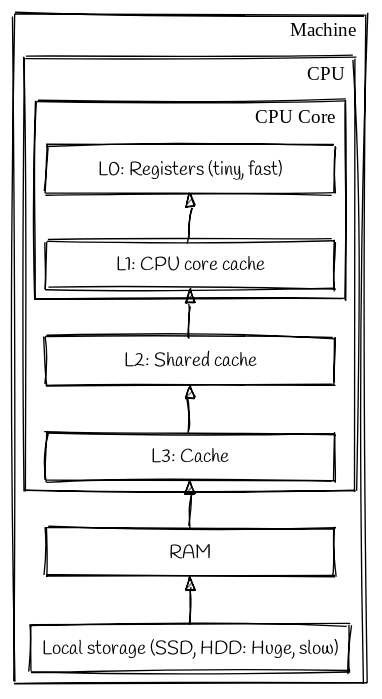
When you run a program execution units in the CPU cores operate on data stored in CPU registers. A register is the fastest form of memory that a CPU core can use, it’s also the smallest. Each register is generally only large enough to contain a single cpu instruction.
Registers sit at the top of a hierarchy of memory locations, followed by the various CPU level caches, and then our main system memory and our long term storage, like hard disks; and way off the bottom somehwere is remote storage, like network file systems. As we travel down the hierarchy the type of memory gets progressively further away and slower to access.
One way we could seriuosly improve our programs performance is to load everything we are ever likely to need into registers or L1 cache before we start executing it. It should be obvious that this is not possible. We cannot fit enough memory cells to hold all possible data we might ever want to operate on into a CPU die. Even if we could, the size of the cache would be so phsically large that the performance difference between getting a bit from the closest side to the core vs the areas farthest away would likely be significant.
Anyway, for the purpose of the rest of this post, we’re going to focus on what we can do to improve performance of the CPU level caches.
Data locality
One important concept that we can exploit to improve cache performance is data locality.
The various caches operate in sections. This means that when we want to go and fetch something from memory we can’t just arbitrarily fetch the bytes we care about - we have to fetch data in multiples of some arbitrary section size. These sections are called cache lines and are typically 64 bytes on modern CPU’s.
As an example, say we are fetching an RVALUE from the heap in a Ruby programs. struct RVALUE is 40 bytes long, so we’ll fetch one cache lines worth of data, 64 bytes, starting at the beginning of our RVALUE. This will actually cache our 40 byte RVALUE and the first 24 bytes of the RVALUE immediately next to it in the heap.
It follows then, that if we were to locate two objects that were often accessed together (for example an RVALUE representing a Ruby String object, and the underlying character buffer in memory), then the cache would require fewer cache fetches, as it’s more likely that the character buffer (or at least part of it) is already cached when the CPU tries to access it.
These cache hits are much faster than cache misses: the time it would take to try and find the data in the cache, realise it isn’t there, and then load it and cache it.
So if we can optimise our programs to have better data locality, then it follows that the CPU will have fewer cache misses, and will therefore be faster.
This is the main premise of one of the projects I’m involved with right now at work. Our hypothesis is that improving Ruby’s heap layout will give our programs better data locality and will make execution of Ruby code faster.
Measuring cache hits
Before we can claim to have improved data locality we need to have a way of measuring cache performance.
This is where perf comes in. It’s a command line utility that makes use of some hardware counters in Intel CPUs and a Linux kernel subsystem called Performance Counters for Linux (PCL) to collect and report on various statistics and tracepoints for programs running on the processor.
We’re specifically interested in perf mem. This page in the Redhat documentation has a load of good information on how to get started running perf mem.
The basic gist is that we have to use two seperate commands:
perf mem record: We can use this as a wrapper for the process whose memory use we wish to profile, and it’ll sample the program at various points and record stats about memory loads (when data is read from memory) and stores (when memory is written to memory). It writes it’s output in a file calledperf.datain the current directory.perf mem report: This allows us to view and generate reports for the data that we collected withrecord. There are a few different ways we can do this: the default is a TUI that we can move around in and drill down through each section of memory event, there’s also a way of viewing parts of a report onstdoutusing a built-in pager. There’s also even a built-in GTK2 frontend, but I haven’t used that yet as I’ve been working on a remote machine, and can’t be bothered with X-Forwarding.
Installing perf-mem
These tools live in the linux-tools packages. The easiest way to get everything you need is to:
sudo apt-get install linux-tools-common linux-tools-generic linux-tools-`uname -r`
I am working on a bare metal AWS machine so I also installed the linux-tools-aws meta-package so that I could keep everything up to date. If you don’t do this then you may see a warning when you run perf after a system upgrade that it cannot be found for your kernel.
If you don’t want to install the linux-tools-aws package then you can just install linux-tools-\uname -r`` again, and everything should be fine.
Collecting data
The simplest use of perf mem report is this:
sudo perf report -- hostname
This is going to run the hostname command with perf. Looking at the output we can see
ubuntu@kyouko:~$ sudo perf record -- hostname
kyouko
[ perf record: Woken up 1 times to write data ]
[ perf record: Captured and wrote 0.006 MB perf.data (10 samples) ]
It turns out that the number of samples is completely configurable using the -F parameter. By default perf samples at 4000Hz - so 4000 samples a second. If we wanted to increase that, to that we can get a better view into our short-lived program we could use max to sample at the maximum allowed frequency (10kHz on my box).
ubuntu@kyouko:~$ sudo perf record -Fmax -- hostname
info: Using a maximum frequency rate of 100000 Hz
kyouko
[ perf record: Woken up 1 times to write data ]
[ perf record: Captured and wrote 0.012 MB perf.data (169 samples) ]
You can change the max frequency by altering the kernel.perf_event_max_sample_rate sysctl parameter if you really want to, but it’s probably not necessary for most uses.
Another parameter I have found useful is --call-graph: this allows you to specify which debugger data format your binaries have been compiled with, and generates a call-graph so you can see exactly which parts of your code are responsible for memory related things.
Let’s have a real world example. I’ve compiled a version of Ruby that I want to benchmark. I’ve used these compile settings to enable debug symbols and turn off compile time optimisations, because I want to be able to read the call graph.
export debugflags='-g'
export optflags='-O0'
export RUBY_DEVEL='yes'
Now I want to run Railsbench using my custom Ruby binary. I’d change directory into the railbench checkout and run this:
sudo --preserve-env=GEM_ROOT,GEM_HOME,GEM_PATH perf mem record --call-graph dwarf -F 100 -- setarch x86_64 -R nice -20 taskset -c 75 $HOME/.rubies/master/bin/ruby bin/bench
That all feels a bit “draw the rest of the fucking owl” compared to the simple commands we’ve looked at so far, so lets break it down:
sudo --preserve-env=GEM_ROOT,GEM_HOME,GEM_PATH: Our railsbench command is going to be run under sudo which will create a new shell with an emptyenv. In order to use the gems we’ve installed into our bundle, we need to forward these variables from our users environment.perf mem record --call-graph -F 200: I’ve dropped the frequency down to 100Hz from 4000Hz. Railsbench is a complex program so we probably don’t need quite as many samples in order to get an accurate picture of what’s going on. I don’t really have any advice to give on how to tune this variable - I’m still learning so please @ me with why I’m wrong, but 200 gives me a more manageable 12MB of data to process rather than ~240MB when left at the default
Now everything after the -- is my benchmark command:
setarch x86_64 -R: report the architecture in our programs environment asx86_64, and turn off address space randomization. ASR is a security feature that randomizes the address space of a program to prevent functions being places at predictable addresses in memory. We turn this off when benchmarking to remove it as a variable between runs.nice -20: This tells the process scheduler to give our process a different priority on the CPU. Negative numbers, down to -20 tell the scheduler to favour our process, positive numbers from 0 to 19 tell the scheduler to favour other processes.taskset -c 75: Constrain this process so that it only runs on the 75th core of this machine (subtle flex there).$HOME/.rubies/master/bin/ruby bin/bench: I compiled Ruby with--prefix=$HOME/.rubies/masterso this is where my custom binary lives, andbin/benchis the script to execute in Railsbench.
Now that we’ve got some data, let’s go and look at it